 |
|
Objectives:
The study of the near-bottom currents in the Barents Sea has the large scientific and ap-plied significance as much pollution (including dangerous radioactive and industrial wastage) are buried at the bottom and are transferred by near-bottom currents in the whole of basin. The purpose of the Project is the reconstruction of the near-bottom current fields for the fore-cast of transport and distribution of the dangerous pollutions.
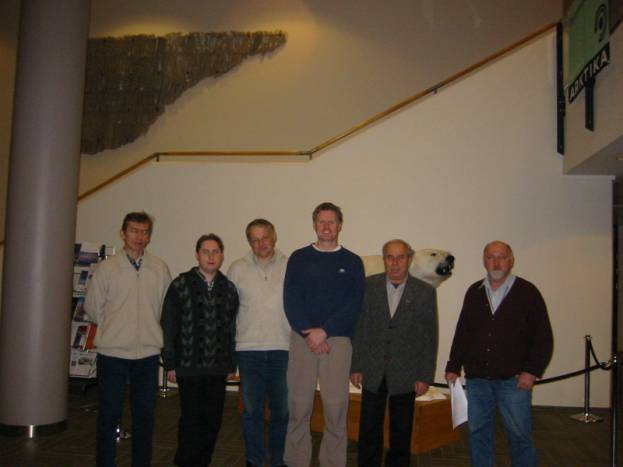
Project performers:
|
|
Fig. 1 Norwegian and Ukrainian teams in the Norwegian Polar institute: left to right |
Summary:
Calculation of fields of stationary near-bottom currents in the Barents Sea for the pe-riod from 1950 till 2000 is carried out on the basis of hydrographic data in file "BarKode" and of the NCEP wind fields above the Barents Sea for the specified period. The accounts are executed for winter (November to the end of April), spring (May to the end of June), summer (July to the end of August) and autumn (September to the end of October) periods and take into account distributions of density, wind friction stress, ice concentration and seabed relief.
|
N
|
N
|
|
N
|
N |
|
Fig. 2 The field of the climatic near-bottom velocity in Barents Sea |
|
|
|
|
|
Fig. 3
Comparison of measured ( |
|
|
N
|
N |
|
|
|
The calculated fields of the stationary velocity on the top border of the frictional BBL are characterized by the following features.
1.1. Significant heterogeneity of the BBL velocity field, which change from shares of cm/s up to 4.7…5 cm/s in local zones of their intensification. These zones located in places of significant seabed inclinations.
1.2. Seasonal variability of the near-bottom currents is determined by a complex of conditions connected with changes of the wind field, water density and ice concentration. The spatial structure of climatic near-bottom currents changes from a season to a season a little, their velocities change as follows: in winter season the maximal velocity is equal 4.84 cm/s, in the spring - 1.73 cm/s, in the summer - 4.80 cm/s, an autumn 2.25 cm/s.
Real dynamics of the BBL layer is much more complex than the calculated fields of stationary near-bottom currents. Except for these fields, that exist significant on velocity of the non-stationary, mainly reversive currents of the tidal period, and also the synoptic currents caused by eddies, meanders of currents, shelf waves of various scales and other dynamic processes These fluctuations of velocity form additional turbulent stresses at the seabed which together with stationary near-bottom currents impact on the diffusion and transport of a benthonic suspension (including dangerous pollution). Nevertheless, the basic influence on average transport of such suspension is rendered with stationary near-bottom currents which calculations here are carried out.
2. Value of integrated transport in stationary BBL is extremely non-uniformly distributed in the Barents Sea, it intensification occurs in zones with significant seabed inclination and does not exceed of 0.2 m2/s.
3. The BBL
thickness is calculated by several independent methods, including with the account of the near-bottom density stratification and Earth rotation.
If to use average Brunt-Vaisala frequency in the BBL equal to ![]() rad/s and maximal value
of velocity on the top BBL border (
rad/s and maximal value
of velocity on the top BBL border (![]() cm/s), the various ratings of the BBL thickness are
equal to 5.7 m, 2.4…5.7 m, 2.7…6 and 4 m. First and second of them take into account only Earth rotation, third - only near-bottom density
stratification and fourth - both of these factor. The rather close ratings of the BBL thickness in considered conditions mean that a major
factor is the Earth rotation.
cm/s), the various ratings of the BBL thickness are
equal to 5.7 m, 2.4…5.7 m, 2.7…6 and 4 m. First and second of them take into account only Earth rotation, third - only near-bottom density
stratification and fourth - both of these factor. The rather close ratings of the BBL thickness in considered conditions mean that a major
factor is the Earth rotation.
Maximal rating of the coefficient of turbulent viscosity (or coefficient vertical momentum diffusion) is close to 5 cm2/s.
4. The ratings of
coefficient of vertical turbulent density diffusion ![]() in the BBL are received on the basis
of the statistical data on the Brunt-Vaisala frequency
in the BBL are received on the basis
of the statistical data on the Brunt-Vaisala frequency ![]() in this area, and also its
connection with dynamic Richardson number. The approximation of kind
in this area, and also its
connection with dynamic Richardson number. The approximation of kind ![]() is used which takes
into account the limited range of change
is used which takes
into account the limited range of change ![]() in the near-bottom area. Density of distribution
of probabilities of
in the near-bottom area. Density of distribution
of probabilities of ![]() values, its average value (2.34 cm2/s) and standard
deviation (1.52 cm2/s) is calculated. These estimations concern to all water area of the Barents Sea and they correspond to the data
of specialized measurements in the benthonic layer.
values, its average value (2.34 cm2/s) and standard
deviation (1.52 cm2/s) is calculated. These estimations concern to all water area of the Barents Sea and they correspond to the data
of specialized measurements in the benthonic layer.
 E
E E
E E
E E
E
 E
E E
E