Federal State Budget Scientific Institution
Federal Research Center "Marine Hydrophysical Institute of RAS"
Remote Sensing Department
CRDF project UG2-2425-SE-02
"Improved Methodology for Assessing the Impacts of the Aegean-Black Sea Exchange"
Project |
Results
US Coordinator: Tom S. Hopkins, North Carolina State University, USA
Ukraine Coordinator: Evgeny M. Lemeshko, Marine Hydrophysical Institute, Ukraine
Objectives:
- to assemble the necessary satellite imagery and T\P-ERS SLA data, and in-situ observations (CTD casts, meteo, gauge data) to support the interpretive analyses;
- to reveal the potentialities and limitations of satellite observations for monitoring of the Black Sea outflow to the Aegean Sea;
- to describe the observed typical cases of the Black Sea water spreading in the North Aegean by means of analysis of multi-sensor remote sensing data and in-situ observations over various time scales;
- to develop and validate the numerical model to the Strait exchange;
Field Data Collection:
- CTD Data from the Aegean Sea were retrieved from the MEDATLAS data base provided by the Hellenic National Oceanographic Data Centre (HNODC). Some additional data not included in the MEDATLAS yet were provided by NCMR researchers.
- CTD data from the Black Sea were provided by the Marine Hydrophysical Institute data base.
- Black-Sea water budget components provided by the Marine Branch of the Ukrainian Hydrometeorological Station.
- Sea-level data were provided by the Marine Hydrophysical Institutes data base, the Hydrographic Service of the Hellenic Navy, and the data base of the Permanent Service for Mean Sea Level of Proudman Oceanographic Laboratory.
- Surface heat and water flux data were additionally provided by the European Center for Medium-Range Weather Forecasts (ECMWF) reanalysis fields.
- Surface temperature and salinity: Athos and Lesvos Poseidon buoys, NCMR, Greece.
- Tide-gauge sea level data: THESSALONIKI, SIROS, HIOS, ALEXONDRUPOLIS MENTESH
Remote Sensing Data Collection:
- Satellite altimetry was employed, using TOPEX/POSEIDON and ERS1-2 satellite altimeters, to assess the evolution of sea-level difference between the two basins.
- Thermal and optical images (NOAA satellites and SeaWifs) were employed in order to assess the extent of the Black Sea outflow into the Aegean Sea.
Fig. Tp-ERS 18415 for 2-11 June, 2000 Habs, [cm] SST AVHRR and SeaWiFS on June 11, 2000: saline water reach to Athos buoy (arrow marks the buoy position) cf. slide 9.
Fig. SST AVHRR NOAA and SeaWiFS Chl "a" on 25 June, 2002.
Summary:
- SST and visual NOAA AVHRR data were processed and images database has been developed for 1997-2004 period (more than 2500 images);
- SST NOAA AVHRR and surface temperature on POSEIDON buoys are in a good agreement;
- the first approximation of a reference surface for altimetry data by dynamic topography derived from historical CTD casts reveals a reasonable results;
- the multidisciplinary approach for describing the observed spreading of the Black Sea waters gives us an encouraging methodology to study the dynamical and environmental effect of the Black Sea and Marmara water impact on the North Aegean.
Ongoing research:
- to study the observed spreading of the Black Sea waters in the North Aegean with respect to wind forcing;
- to establish an advanced reference surface for the altimetry data in the Aegean from historical CTD casts by the steric height method (Hopkins, 1997; Lemeshko, Hopkins, 2002).
Water exchange in the Black and Aegean seas system based on the joint assessment of water and salt budgets:
- This study was initiated in frameworks of the Greek-Ukrainian collaborative project The Black and Aegean seas interaction and exchange: an integration of in-situ measurements, satellite data and numerical modeling;
- The main goal: to develop the box-model for estimation of large-scale water exchange fluxes basing on joint solution of water and salt budget equations (other names of the approach: reservoir models, balance models);
- Such an approach is the first step in attempts to re-analyze available databases and to organize them for the next studies, including numerical modelling and satellite data time-series analysis;
- Scales considered are: spatial ~ 100 - 1000 km (basins and basin systems); time ~ 10 - 100 years.
|
The Black-Aegean Seas System:
Regioning:
- Sea of Azov (separated by the Kerch Str.);
- NW Black Sea shelf (<100m, sep. by latitude 44°40N);
- Deep Black Sea (sep. by the Bosporus St.)*;
- Sea of Marmara (sep. by the Dardanelle St.);
- North Aegean Sea (sep. by lat. 38°30N);
- South Aegean Sea (sep. by Cretan Straits).
* Deep BS can be geographically divided by longitude 34°E, but Western and Eastern parts of the Deep Black Sea are almost the same in mean salinity profiles
|
|
Results: 1 basin, 1 layer (The Black Sea):
- Annual water balance components estimated in MB UHMI for the 1923-1998 year period (left picture) were used for the calculations of exchange fluxes with the Marmara Sea (polynomial fits of 3-rd degree are shown). Results (advective outflow and turbulent exchange vs freshwater flux) are on the right picture. Both flows increase with the freshwater input providing stable salinity;
- Two intervals of large-scale variability can be selected basing on freshwater flux changes (depending mainly on evaporation decrease): 1923-1959 and 1960-1998.
Results: 2 basins, 2 layers (1960-1998):
Kerch St.
|
Fw = 245
 |
Bosporus
|
Fw = -4
 |
Dardanelles
|
Qout = 16
 |
Black Sea
surface
S = 18.17 psu
T2 = 24 yrs |
Qout=541
 |
Marmara Sea
surface
S = 26.7 psu
T2 = 0.24 yrs |
Qout = 1458
|
|
 
Qz = 1276
Qe = 264 |
|
Qz = 51
Qe = 921 |
North Aegean
deep:
S = 38.8 psu |
|
Black Sea
deep
S = 22.09 psu
T2 = 349 yrs |
Qin = 264
 |
Marmara Sea
deep
S = 38.3 psu
T2 = 3 yrs |
Qin = 1185
|
- Green arrows and digits indicate input data while red ones estimation results;
- Volumetric fluxes are in km3/year;
- Azov Sea inflow is taken from 1-layer solution.
Table. Some other estimations of advective fluxes (km3/year) through the Turkish Straits
| Source: |
Advective fluxes,
Bosporus |
Advective fluxes,
Dardanelles |
| QOUT |
QIN |
QIN - QOUT |
QOUT |
QIN |
QIN - QOUT |
U. Unluata et al., 1990
(balance estimates) |
612 |
312 |
-300 |
1257 |
957 |
-300 |
MB UHMI (mean values for
1960-1998 Black Sea
water balance) |
411 |
153 |
-258 |
- |
- |
- |
Ozsoy et al., 1996 (mean
values of ADCP measurements
for 1991-1995) |
540 |
115 |
-425 |
- |
- |
- |
Maderich and Ilyin, this
issue (mean values of model
results for 1969-1999) |
545 |
244 |
-301 |
1237 |
940 |
-297 |
QEn vertical entrainment flow from the deep layer directed upward;
QZn vertical turbulent exchange flow between surface and deep layers balancing salinities in the basin
In estimating the basin exchange flows by Thermohaline Exchange Method
[T. S.Hopkins 1999 J.Marine Systems 20; 2001 Scientia Marina, 65]:
The Water Balance creates the Force
The Force drives the Exchange
The Exchange then modifies the Force
- This method of assessing the exchange flows is based on the assumption that the exchange is proportional to the internal potential energy difference between the two basins, at the depth of the sill;
- Here, historical data are exploited in estimating the pycnocline depth as well as the sea-level at both sides of the Straits, thus enabling a first-order estimation of the exchange. The effects of the feedback mechanisms on the solution are explored and analyzed.
Fig. The Black Sea Water Balance and Surface Salinity from 1963 to 1993, in km3/mo & ppt. The Water Balance is green & the Salinity is orange.
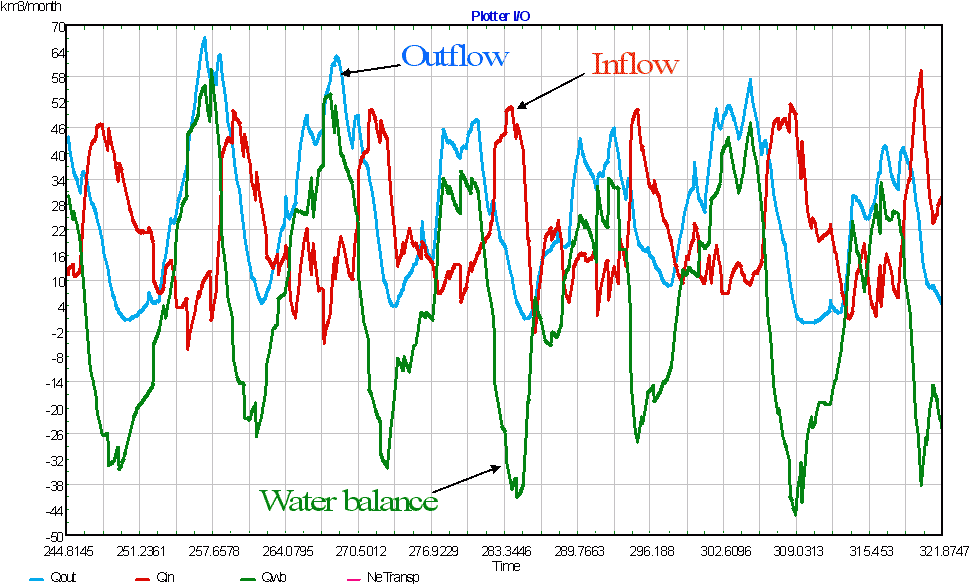
Fig. Example of the phasing between the Black Sea Water Balance, Outflow & Inflow, in km3/month from Apr 1943 to Oct 1958 [by Thermohaline Exchange Method] .
In estimating the basin exchange flows by two-layer hydraulics model:
Here, two kinds of models are employed:
- Sea models, simulating the water column as a series of homogeneous layers that can move vertically depending on entrainment or detrainment processes. These models are used for the Black and Marmara Seas;
- Strait models, using two-layer hydraulics following the hydraulic control principle that the internal composite Froude number of the flow G = 1 at some critical section of the strait. These are used in the Bosphorus and Dardanelles Straits;
- The models are run for the period 1969-1999, forced by time-series of wind, air-temperature and freshwater influx.
Fig. From observation: Sea surface salinity of the Marmara Sea (S.Besiktepe et.al., 1994).

Fig. Comparison: Hydraulic + mixing model results.
Exchange flow in Dardanelle strait by 3D non-hydrostatic model:
Objectives:
- To validate concept of maximal exchange for long strait;
- To study effects of entrainment and friction on the hydrodynamics of long strait.
Calculations with 3D model with k-l turbulence closure for Summer
Conclusions:
- The 3D non-hydrostatic numerical model for calculating free-surface stratified flows is being developed;
- The model algorithm is computationally effective and it is fully compatible with wide used class of hydrostatic models with time-splitting technique and terrain-following vertical coordinates;
- The several examples demonstrate model ability as tool for simulation of wide spectrum of unsteady non-hydrostatic stratified free surface flows in domain with complicated geometry.
Project |
Results
Remote Sensing Department (together with LLC "DVS LTD")
Federal State Budget Scientific Institution Federal Research Center "Marine Hydrophysical Institute of RAS"
2, Kapitanskaya St., Sevastopol, 299011, Russian Federation
Phone: +7 (8692) 54-50-65
© 2002—2024
If you have a questions or comments about this site, please send mail to
webmaster