 |
|
Results
Fig.1 SST AVHRR on 17 Nov., 2000 and TP-ERS SLA #18575 (9-18 Nov., 2000):
(a) MSLA; (b) Habs with respect Href (spatial means removed), [cm].
Inverse triangular marks the Poseidon buoys.
Fig. 2 Surface temperature and salinity at z=3m; Athos buoy (39.96N; 24.72E): (a) 2000 and (b) 2001. Deployment: since 25/05/2000.
Fig. 3 Temp. and Sal. at z=3m at Athos Buoy (39.96N; 24.72E): (a) June 2000 and (b) June, 2002.
Fig. 4 (a) Tp-ERS 17685 for 3-12 June, 1998, Habs, [cm] and SST AVHRR on June 12, 1998;
(b) Tp-ERS 17705 for 23 June - 2 July, 1998, Habs, [cm] and SST AVHRR on June 29, 1998.
Fig. 5 Tp-ERS 18055 for 8-17 June, 1999 Habs, [cm] and SST AVHRR & and SeaWiFS on June 17, 1999.
Fig.6 Seasonal circulation: MedAtlas DT 0/500 db: (a) Winter; and (b) Summer. Inverse triangular marks the Poseidon buoys.
Fig. 7 Seasonal surface temperature (a,c) and salinity (b,d) (MedAtlas data):
(a,b) - winter (Jan., Feb., March); and (c, d) summer (July, Aug., Sept.).
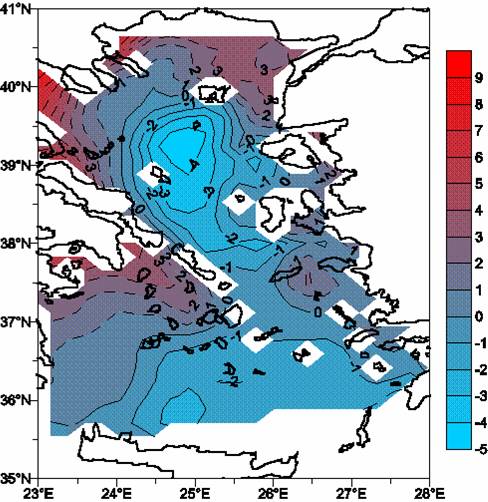
Fig. 8 Mean dynamic topography Href for TP_ERS (spatial mean removed), [cm], used to determine the reference surface for altimetry data in Aegean. Dynamic topography 0/500 db (annual CTD data) calculated by extended method (Fomin, 1964).
Fig. 9 Mean sea level of the Aegean sea (gauge - blue solid; T\P - red solid line).
Fig. 10 1993-2000: Principal component-1 (top) and Eof-1 (bottom) : 30% of total variance.
Pc1corr of T\P ERS SSHabs and its running moving.
Fig. 11 1993-2000: Principal component-2 (top) and Eof-2 (bottom) : 15% of total variance.
PC2 of T\P ERS SSHabs and its running moving.